Amazon TACoS Divides by Money a Merch or KDP Seller Never Receives
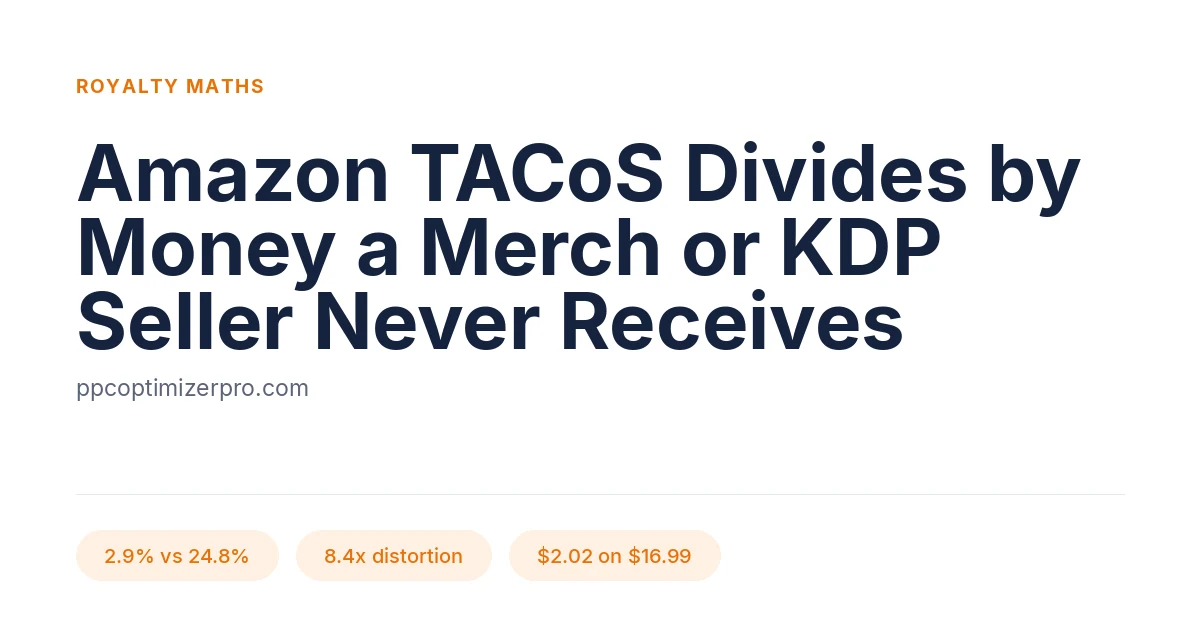
Search Amazon TACoS and you get much the same page over and over: a definition, the formula, and a closing line about organic sales compounding. All of them quietly describe a private-label seller who receives the sale price. If you sell on Merch on Demand or KDP you never receive the sale price. Amazon does, and it pays you a royalty out of it. It does not even report the sale price back to you.
What Amazon TACoS means and how to calculate it
TACoS stands for total advertising cost of sales. It is an industry coinage rather than an Amazon metric, since Amazon defines ACOS and has never published a TACoS figure. It measures the percentage of your total sales revenue, advertised and organic together, that goes back out as ad spend.
The TACoS formula is:
TACoS = ad spend / total sales revenue x 100Both figures must cover the same period. That is how to calculate TACoS, and every argument worth having about the metric is an argument about what belongs in the denominator.
ACoS vs TACoS
ACoS uses only ad-attributed sales as the denominator. TACoS uses every sale you made.Take a Merch account that spent $100 on ads last month and sold 200 shirts at $16.99, 60 of them attributed to ads.
- Ad-attributed sales: 60 x 16.99 = $1,019.40, so ACoS = 100 / 1019.40 = 9.8%.
- Total sales: 200 x 16.99 = $3,398, so TACoS = 100 / 3398 = 2.9%.
TACoS divided by ACoS is the ad-attributed share of your revenue: 2.9429 / 9.8097 = 0.30, which is just 1,019.40 / 3,398. That matches 60 units out of 200 only because every unit here is the same price, and across a mixed catalogue it is a revenue share.
On the same sales over the same period, TACoS lands below ACoS. Reported figures do invert, and that is an artefact: Sponsored Brands and Sponsored Display attribute halo sales of ASINs never in the campaign, and attribution dates a sale to the click while total sales are counted at the order date. Anyone in Amazon PPC telling you to watch for a low ACoS alongside a high TACoS is describing a rounding error in the calendar.
The gap is a signal about organic share, not efficiency. A high ACoS with a much lower TACoS means ads are expensive per attributed sale but small next to the business, so organic is carrying you. An ACoS of 30% beside a TACoS of 27% means ad sales are 27 / 30 = 90% of what you sold, and switching off leaves nothing underneath. Neither tells you whether you made money. That belongs to your margin, which is where the formula falls apart for a royalty seller.
The denominator a royalty seller never receives
The Merch on Demand dashboard gives you units and royalties, not revenue. To produce a textbook TACoS you would have to multiply units by list price yourself, which tells you whose number it is.
Start with the royalty, which is no longer a figure anyone can quote at you. Since 1 June 2026 Merch assigns each account a royalty incentive group every month, Creator, Plus or Premium, on the share of sales driven by non-organic traffic across a trailing 60-day window. The same shirt at the same price now pays different royalties to different accounts, so pull yours from the Merch royalty page first.
Call the royalty R on that $16.99 tee. Break-even ACoS is R / 16.99: at an R of $2.02 that is 11.9%, and at $2.80 it is 16.5%. What follows uses $2.02, our own account's rate.
Textbook TACoS said 2.9%. Run the same division against money that reaches the bank: royalties were 200 x 2.02 = $404, and 100 / 404 = 24.8%. Same month, same spend, same units. One number says you spend under three cents per dollar of business, the other says a quarter of what you earned went to Amazon Ads.
The second is true, because all $3,398 of that revenue belongs to Amazon before your royalty is calculated. List price is yours to set, so you do influence the royalty, but you have no claim on that revenue and no cost sitting inside it. The distortion is simply the ratio of price to royalty: 16.99 / 2.02 = 8.4, or 6.1 on the higher royalty, close to an order of magnitude either way.
Returns make it worse. Across 60 days of our own Merch returns data, 9.1% of US units came back, and Amazon claws a returned royalty back as a negative adjustment. That leaves 2.02 x 0.909 = $1.84 effective, so 200 x 1.84 = $368 and 100 / 368 = 27.2%. Return rates vary by garment, so pull your own.
The same maths for KDP, where it is milder
A $4.99 ebook on the 70% option with a 1MB file nets 0.70 x (4.99 - 0.15) = $3.39, a price to net ratio of 4.99 / 3.39 = 1.5.
Paperbacks depend on page count, which posts quoting a single figure skip. US royalty is 60% of list price minus printing, and black ink on white paper costs $1.00 plus $0.012 a page above 110 pages. A 288-page book at $14.99 costs 1.00 + 3.46 = $4.46 to print and nets 8.99 - 4.46 = $4.53, a ratio of 14.99 / 4.53 = 3.3. A 150-page book prints for $2.80 and nets $6.19, a ratio of 2.4. Most land between roughly 2.2 and 3.4, so run your own page count.
An ebook author reading a textbook TACoS number is out by about 1.5 times, a paperback author by two to three, a Merch seller by six to eight. If you run Amazon ads for books the standard metric is at least directionally usable. On Merch it is not.
The organic flywheel is weaker for print on demand
The standard advice is that TACoS should fall over time: ads seed reviews and velocity, the listing earns organic rank, organic sales compound, and falling TACoS is offered as proof the strategy works. That mechanism is real, and built on the shape of a private-label product: one ASIN, months of accumulated reviews, and a reason to push the same item for a year.
Print on demand is the opposite shape. The catalogue is wide and shallow, most designs sell in low single-digit volumes and never hold organic rank, and a new upload starts with no rank of its own. A shared brand name carries a little, but nothing like a year of history on one ASIN. A design that breaks out compounds exactly as the theory says, but the flywheel is weaker and slower and restarts constantly as the catalogue grows underneath it.
This is a structural difference, not a failure of the seller. Treat a falling TACoS as evidence that ads are working and you may wait a long time. Judge on royalty against spend this month.
What is a good TACoS
There is no universal number, and any post that hands you one has invented it. The ceiling is set by your margin, and for a royalty seller the margin is the royalty. Derive your own.
That second number is why the same 3% means two different things. A Merch seller at 3% sits at 3 / 3.6 = 83% of their ceiling with almost nothing left, while a private-label seller on a 30% gross margin has spent a tenth of theirs. The same trap catches ROAS, which is this problem inverted.
Your ACoS ceiling follows the same logic: 11.9% before returns, and 1.84 / 16.99 = 10.8% after them. The example account ran at 9.8%, clearing that by a point. It is profitable, and nowhere near as comfortable as a 2.9% TACoS makes it look. The bid calculator turns a royalty into a bid ceiling per keyword.
One caveat specific to Merch since June. Your royalty incentive group is reassigned monthly on the share of sales from non-organic traffic, and Sponsored Products is reported to count toward it, so advertising can move the royalty you divide by. Check your royalty page for whether ordinary Sponsored Products clicks count or only Amazon Attribution campaigns. If they do, recalculate the ceiling every month.
Where the two numbers actually live
Ad spend is the easy half. It comes from the Amazon Ads console, reached through the marketing area of the KDP dashboard, the advertising menu in Seller Central, or an ads account linked to your Merch account. Not every Merch account has one enabled. The Advertise your Merch module on the dashboard is where you request it.
Total sales is where the three diverge. An FBA or private-label seller has it easy: Seller Central business reports give ordered product sales, exactly the denominator the textbook formula wants. A Merch seller is given no revenue figure at all, only a royalty-based sales report. A KDP author sits in between, with units ordered and estimated royalties by marketplace and format, and each format carries a different ratio. The two do not line up day for day, for the attribution reasons above, so compare a full month against a full month.
Acting on a royalty TACoS means pulling the search term report, finding the terms spending above your royalty ceiling, and cutting their bids. That is bulk file work, the mechanical half of the job that our optimiser does in royalty terms rather than against a revenue figure you never see. The targets themselves sit in our guide to PPC strategy for royalty products.
Keep reading
Written by
PPC Optimizer Pro Team
The PPC Optimizer Pro Team consists of Amazon sellers and developers who built this tool after years of managing Sponsored Products campaigns manually. We share data-driven strategies to help sellers reduce wasted ad spend and improve ACOS.